Based on preliminary Census Bureau data, the American Iron and Steel Institute (AISI) reported that the U.S. imported a total of 1,864,000 net tons (NT) of steel in August 2025, including 1,402,000 net tons (NT) of finished steel (down 16.8 percent and 16.8 percent, respectively, vs. July 2025). Total and finished steel imports are down 7.0 percent and 10.6 percent, respectively, year-to-date vs. 2024. Over the 12-month period September 2024 to August 2025, total and finished steel imports are down 4.1 percent and 5.7 percent, respectively, vs. the prior 12-month period. Finished steel import market share was an estimated 16 percent in August and is estimated at 20 percent over the first eight months of 2025.
Products with a significant increase in imports over the 12-month period September 2024 to August 2025 compared to the previous 12-month period include tin plate (up 54 percent), wire rods (up 18 percent), line pipe (up 15 percent) and oil country goods (up 10 percent).
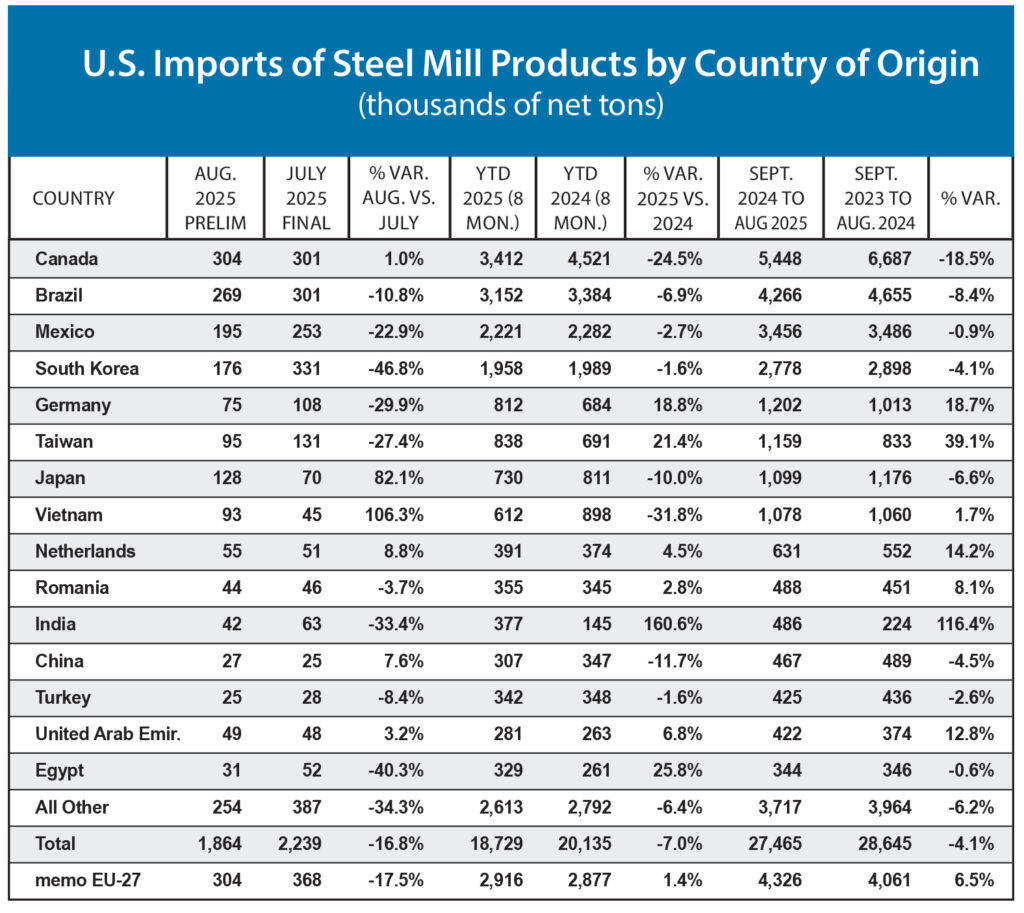
In August, the largest suppliers were Canada (304,000 NT, up 1 percent vs. July), Brazil (269,000 NT, down 11 percent), Mexico (195,000 NT, down 23 percent), South Korea (176,000 NT, down 47 percent) and Japan (128,000 NT, up 82 percent). Over the 12-month period September 2024 to August 2025, the largest suppliers were Canada (5,448,000 NT, down 19 percent vs, compared to the previous 12-months), Brazil (4,266,000 NT, down 8 percent), Mexico (3,456,000 NT, down 1 percent), South Korea (2,778,000 NT, down 4 percent) and Germany (1,202,000 NT, up 19 percent). Below are steel imports by country and estimated finished steel import market share in recent months.
Published November 2025