


Based on preliminary Census Bureau data, the American Iron and Steel Institute (AISI) reported that the U.S. imported a total of 2,495,000 net tons (NT) of steel in March 2025, including 1,819,000 NT of finished steel (up 11.4 percent and 11.9 percent, respectively, vs. February 2025). Total and finished steel imports are up 3.6 percent and 1.6 percent, respectively, year-to-date vs. 2024. Over the 12-month period April 2024 to March 2025, total and finished steel imports are up 3.4 percent and 4.1 percent, respectively, vs. the prior 12-month period. Finished steel import market share was an estimated 21 percent in March and is estimated at 22 percent over the first three months of 2025.
Key steel products with a significant import increase in March compared to February are reinforcing bars (up 86 percent), line pipe (up 48 percent), oil country goods (up 41 percent), sheets and strip all other metallic coated (up 40 percent) and cold rolled sheets (23 percent). Products with a significant increase in imports over the 12-month period April 2024 to March 2025 compared to the previous 12-month period include tin plate (up 67 percent), sheets and strip all other metallic coated (up 27 percent), wire rods (up 24 percent), cold rolled sheets (up 19 percent) and sheets and strip hot dipped galvanized (up 19 percent).
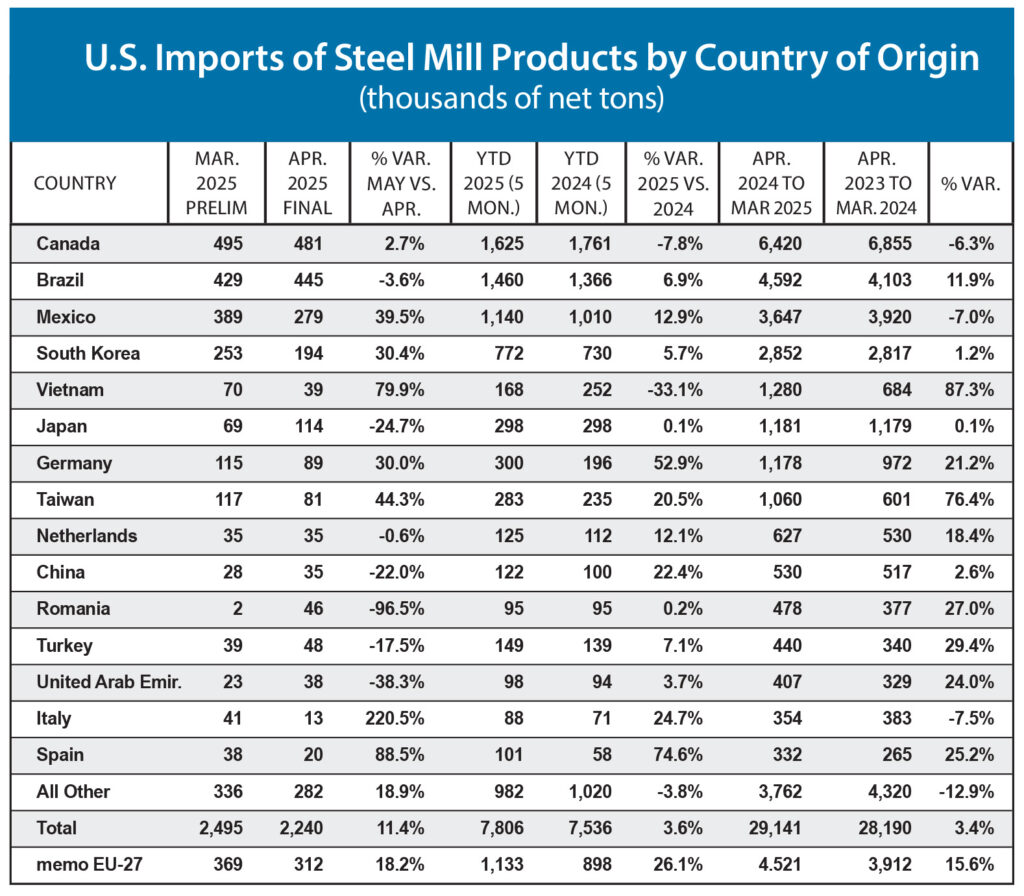
In March, the largest suppliers were Canada (495,000 NT, up 3 percent vs. February), Brazil (429,000 NT, down 4 percent), Mexico (389,000 NT, up 40 percent), South Korea (253,000 NT, up 30 percent) and Taiwan (117,000 NT, up 44 percent). Over the 12-month period April 2024 to March 2025, the largest suppliers were Canada (6,420,000 NT, down 6 percent vs, compared to the previous 12-months), Brazil (4,592,000 NT, up 12 percent), Mexico (3,647,000 NT, down 7 percent), South Korea (2,852,000 NT, up 1 percent) and Vietnam (1,280,000 NT, up 87 percent). Below are charts on steel imports by country and estimated finished steel import market share in recent months.
In March, the largest suppliers were Canada (495,000 NT, up 3 percent vs. February), Brazil (429,000 NT, down 4 percent), Mexico (389,000 NT, up 40 percent), South Korea (253,000 NT, up 30 percent) and Taiwan (117,000 NT, up 44 percent). Over the 12-month period April 2024 to March 2025, the largest suppliers were Canada (6,420,000 NT, down 6 percent vs, compared to the previous 12-months), Brazil (4,592,000 NT, up 12 percent), Mexico (3,647,000 NT, down 7 percent), South Korea (2,852,000 NT, up 1 percent) and Vietnam (1,280,000 NT, up 87 percent).
Published June 2025